
The BIS 2022 Triennial Central Bank Survey: $7.5 Trillion Daily FX Volume, USD, EUR, JPY, GBP & CNY Top 5 Most Traded
 New York City, United States Caproasia.com | The leading source of data, research, information & resource for investment managers, professional investors, UHNW & HNW investors, and advisors to institutions, billionaires, UHNWs & HNWs. Covering capital markets, investments and private wealth in Asia. How do you invest $3 million to $300 million? How do you manage $20 million to $3 billion of assets? Caproasia - Learn more This site is for accredited investors, professional investors, investment managers and financial professionals only. You should have assets around $3 million to $300 million or managing $20 million to $3 billion.
 The BIS 2022 Triennial Central Bank Survey: $7.5 Trillion Daily FX Volume, USD, EUR, JPY, GBP & CNY Top 5 Most Traded
 29th October 2022 | Hong Kong
The Bank for International Settlements (BIS) has released the 2022 Triennial Central Bank Survey (released every 3 years), providing key data & insights into the global foreign exchange & derivatives daily turnover (Spots, forwards, swaps, options) in 2022, the most traded currencies and the countries processing the most FX & derivatives trades. In 2022 April, global foreign exchange (FX) daily trading volume is at $7.5 trillion (2019: $6.5 trillion), with the most traded foreign exchange USD with $6.66 trillion, representing 88.5% of FX trades. The top 5 traded currencies are USD, EUR, JPY, GBP and CNY (RMB). In 2022 April, the total OTC (Over-the-counter) interest rate derivates volume at $5.22 trillion, with the most traded interest rate derivative USD with $2.22 trillion, representing 43.5% of trade volumes (OTC Interest Rate Derivatives includes Forward, Swaps, Options, Others). The top 5 most traded OTC interest rate derivatives are USD, EUR, GBP, AUD & JPY. The country processing the most OTC interest rate derivatives daily is United Kingdom with $2.62 trillion, representing 45.5% of global trades. The top 5 OTC interest rate derivatives trading centres are United Kingdom, United States, Hong Kong SAR, Germany & France. Read More: Full Report
“ $7.5 Trillion Daily FX Volume, $5.2 Trillion Interest Rate Derivatives. Top 5 Most Traded FX: USD, EUR, JPY, GBP & CNY. Top 5 FX Centres: UK, US, Singapore, Hong Kong, Japan ”
Ads & Announcements


Foreign Exchange Daily Volume (Spots, and Derivatives)
OTC Interest Rate Derivatives (Forward, Swaps, Options, Others)
The BIS 2022 Triennial Central Bank Survey – Daily FX Volume
 New York City, United States Key Findings (2022 April):
 - Foreign Exchange Daily Volume – $7.5 trillion ($6.5 trillion)
- Most Daily Traded FX – USD with $6.66 trillion (88.5%)
- Top 5 Currencies – USD, EUR, JPY, GBP, CNY
- Top Country (FX Daily Volume) – $3.75 trillion (38.1%)
- Top 5 FX Trading Countries – United Kingdom, United States, Singapore, Hong Kong SAR, Japan
- Total Interest Rate Derivatives Volume – $5.22 trillion
- Top OTC Interest Rate Derivatives – USD with $2.22 trillion (43.5%)
- Top 5 OTC Interest Rate Derivatives – USD, EUR, GBP, AUD, JPY
- Top OTC Interest Rate Derivatives Countries – United Kingdom – $2.62 trillion (45.5%)
- Top 5 OTC Interest Rate Derivatives Countries – United Kingdom, United States, Hong Kong SAR, Germany & France
Foreign Exchange Daily Volume (Spots, and Derivatives)
OTC Interest Rate Derivatives (Forward, Swaps, Options, Others)
FX OTC Daily Turnover 2022 (2019)
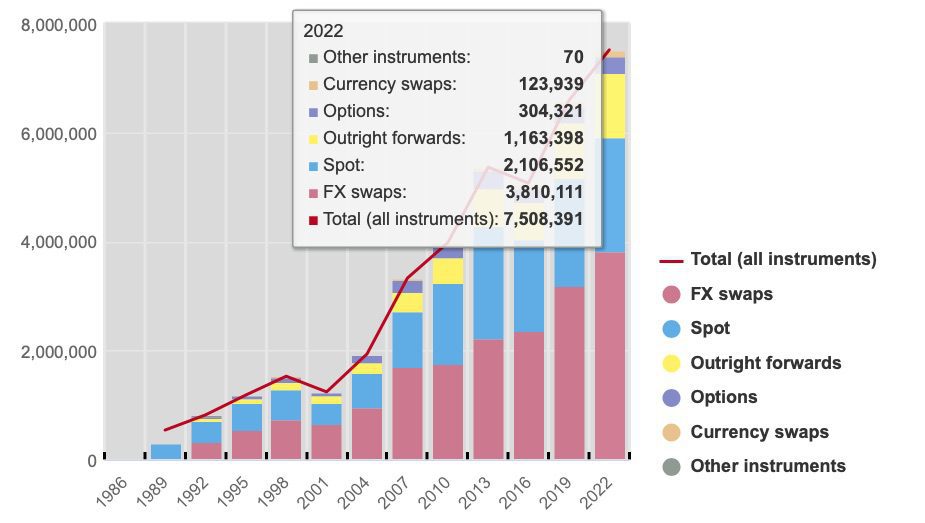 BIS 2022 Triennial Central Bank Survey Daily Foreign Exchange Volume
 - Foreign Exchange – $7.5 trillion ($6.5 trillion)
- Spot – $2.1 trillion ($1.9 trillion)
- Forwards – $1.1 trillion ($997 billion)
- Non-deliverables – $226 billion ($258 billion)
- FX Swaps – $3.8 trillion ($3.1 trillion)
- Currency Swaps – $123 billion ($108 billion)
- Options – $304 billion ($298 billion)
- Others – $70 billion ($36 billion)
1) By Currency – FX Daily Volume Rank Currency Daily Turnover 1 USD $6.66 trillion 88.5% 2 EUR $2.29 trillion 30.5% 3 JPY $1.23 trillion 16.7% 4 GBP $968 billion 12.9% 5 CNY (RMB) $526 billion 7.0% 6 AUD $479 billion 6.4% 7 CAD $465 billion 6.2% 8 CHF $389 billion 5.2% 9 Others $1.99 trillion 26.6% 10 Total $7.5 trillion
FAQ: How would USD account for 88.5% and EUR account for 30.5%, which is more than 100%? Answer: USD is traded against all currencies, including EUR. Of 88.5% of the daily trades, USD is traded. Of 30.5% of daily trades, EUR is traded.
2) By Country – FX Daily Volume Rank By Country Daily Turnover 1 United Kingdom $3.75 trillion 38.1% 2 United States $1.91 trillion 19.4% 3 Singapore $929 billion 9.4% 4 Hong Kong SAR $694 billion 7.1% 5 Japan $432 billion 4.4% 6 Switzerland $349 billion 3.6% 7 France $213 billion 2.2% 8 Germany $183 billion 1.9% 9 Canada $171 billion 1.7% 10 Other countries $1.2 trillion 12.2% 100.0%
OTC Interest Rate Derivatives (Forward, Swaps, Options, Others)
3) By Currency – Daily Volume Rank By Currency Daily Turnover 1 USD $2.22 trillion 43.5% 2 EUR $1.75 trillion 33.5% 3 GBP $350 billion 6.7% 4 AUD $279 billion 5.3% 5 JPY $116 billion 2.2% 6 CAD $60.1 billion 1.2% 7 NZD $47.9 billion 0.9% 8 Korean Won $47.7 billion 0.9% 9 Czech Koruna $31.8 billion 0.6% 10 CNY (RMB) $29.5 billion 0.6% 11 Rand (South Africa) $27.2 billion 0.5% 12 Swedish Krona $24.9 billion 0.5% 13 Indian Rupee $23.1 billion 0.4% 14 Mexican Peso $22.3 billion 0.4% 15 Other Currencies $13.5 billion 2.6% Total $5.22 trillion 100.0%4) By Country – Daily Volume Rank By Country Daily Turnover 1 United Kingdom $2.62 trillion 45.5% 2 United States $1.68 trillion 29.3% 3 Hong Kong SAR $321 billion 5.6% 4 Germany $272 billion 4.7% 5 France $203 billion 3.5% 6 Singapore $155 billion 2.7% 7 Australia $112 billion 2.0% 8 Canada $72.1 billion 1.3% 9 Japan $50.7 billion 0.9% 10 Netherlands $38.2 billion 0.7% 11 Italy $21.4 billion 0.4% 12 Denmark $19.9 billion 0.3% 13 Switzerland $17.7 billion 0.3% 14 Other countries $166 billion 2.9% Total $5.76 trillion 100.0%
FAQs
1. Are cryptocurrencies included in the Survey?
Cryptocurrencies are not included in the Survey. The current statistical recommendations treat cryptocurrencies as assets that do not give rise to a liability because there are no issuers of cryptocurrencies (unlike currencies issued by central banks). Furthermore, they are currently treated as non-financial assets.
2. What is the impact of the Libor transition on the reporting?
Reporting dealers that provide data to national authorities are advised to report single-currency forward rate agreements (FRA) and interest rate swaps (IRS) using the new reference rates (ie overnight risk-free rates, RFRs) for CHF, GBP, JPY, and in addition EUR and USD, as overnight index swaps (OIS). IRS referencing term unsecured rates (such as Euribor, Tibor, ICE Bank Yield Index, The Bloomberg Short Term Bank Yield Index (BSBY), Ameribor or any other forward-looking credit sensitive benchmark) should still be reported as such. In amounts outstanding, the legacy FRA and IRS contracts that originated before the shift to new reference rates (ie overnight RFRs) and affected thereby should be classified as OIS.
3. How do settlement days impact the maturity classification of same day, spot, and FX forward instruments?
Cash/same day transactions should be reported under spot. Settlement for spot is normally up to 2 trading days. FX forwards have longer settlement periods.
The Triennial Survey, the most comprehensive source of information on the size and structure of global FX and OTC interest rate derivatives markets, provides a snapshot of market activity in April 2022. Central banks and other authorities in 52 jurisdictions participated, collecting data from more than 1,200 banks and other dealers in their jurisdictions. The 13th Triennial Survey of turnover in foreign exchange spot markets, foreign exchange and interest rate OTC derivatives markets, is conducted in April 2022. Data on the outstanding notional amounts and gross market values of foreign exchange, interest rate, equity, commodity, credit and other OTC derivatives contracts are collected at end-June 2022 for markets worldwide.
Activity in FX markets has been surveyed every three years since 1986, and in OTC interest rate derivatives markets since 1995. The Triennial Survey is coordinated by the BIS under the auspices of the Markets Committee (for the FX part) and the Committee on the Global Financial System (for the interest rate derivatives part). It has been supported through the Data Gaps Initiative endorsed by the G20.
Bank for International Settlements (BIS)
Established in 1930, the BIS is owned by 63 central banks, representing countries from around the world that together account for about 95% of world GDP. Its head office is in Basel, Switzerland and it has two representative offices: in Hong Kong SAR and in Mexico City, as well as Innovation Hub Centres around the world.
2021 Data Release 2020 List of Private Banks in Hong Kong2020 List of Private Banks in Singapore 2020 Top 10 Largest Family Office2020 Top 10 Largest Multi-Family Offices2020 Report: Hong Kong Private Banks & Asset Mgmt - $4.49 Trillion2020 Report: Singapore Asset Mgmt - $3.48 Trillion AUM Register Below Latest 2022 data & reports, insights & news Every Saturday & Sunday 2 pm Direct to your inbox Save 2 to 8 hours per week. Organised for success For Investors | Professionals | Executives New to Caproasia? Join 10,000 + Learn More | Sign Up Today Caproasia.com | Caproasia Access 2022 Events | TFC - Find Services Grow Business | Contact Us For CEOs, Heads, Senior Management, Market Heads, Desk Heads, Financial Professionals, Investment Managers, Asset Managers, Fund Managers, Hedge Funds, Boutique Funds, Analysts, Advisors, Wealth Managers, Private Bankers, Family Offices, Investment Bankers, Private Equity, Institutional Investors, Professional Investors Get Ahead in 60 Seconds. Join 10,000 + Save 2 to 8 hours weekly. Organised for Success. Subscribe / Sign Up / Contact Us Sign Up / Subscribe:
Mailing ListFree TrialInvestor $680 YearlyProfessional $680 YearlyExecutive $2,000 Yearly
Interests / Events / Summits / Roundtables / Networking:
Private WealthFamily OfficePrivate BankingWealth ManagementInvestmentsAlternativesPrivate MarketsCapital MarketsESG & SICEO & EntrepreneursTax, Legal & RisksHNW & UHNWs Insights
Your Name*
Company*
Job Title*
Email 1 (Work / Personal)*
Email 2 (Work / Personal)
Contact No.
Country
Your Message (leave blank if none)
Owl Media Group takes pride in providing social-first platforms which equally benefit and facilitate engagement between businesses and consumers and creating much-needed balance to make conducting business, easier, safer, faster and better. The vision behind every platform in the Owl Media suite is to make lives better and foster a healthy environment in which parties can conduct business efficiently. Facilitating free and fair business relationships is crucial for any thriving economy and Owl Media bridges the gap and open doors for transparent and successful transacting. No advertising funds influence the functionality of our media platforms because we value authenticity and never compromise on quality no matter how lucrative the offers from advertisers may seem.