
IMF World Economic Outlook 2023: GDP +2.9% in 2023 with Inflation at 6.6%, Key Drivers & Risks are Inflation, China Recovery, Domestic Economic Streng
 Shanghai, China Caproasia.com | The leading source of data, research, information & resource for financial professionals, investment managers, professional investors, family offices & advisors to institutions, billionaires, UHNWs & HNWs. Covering capital markets, investments and private wealth in Asia. How do you invest $3 million to $300 million? How do you manage $20 million to $3 billion of assets? Caproasia - Learn more Caproasia Access | Events | Summits | Register Events | The Financial Centre The 2023 Investment Day | 2023 Family Office Summits | Family Office Circle This site is for accredited investors, professional investors, investment managers and financial professionals only. You should have assets around $3 million to $300 million or managing $20 million to $3 billion.

 IMF World Economic Outlook 2023: GDP +2.9% in 2023 with Inflation at 6.6%, Key Drivers & Risks are Inflation, China Recovery, Domestic Economic Strength, Supply Side, Russia War in Ukraine, Geo-Politics, COVID-19, Debt Distress & Financial Market Repricing
 10th February 2023 | Hong Kong
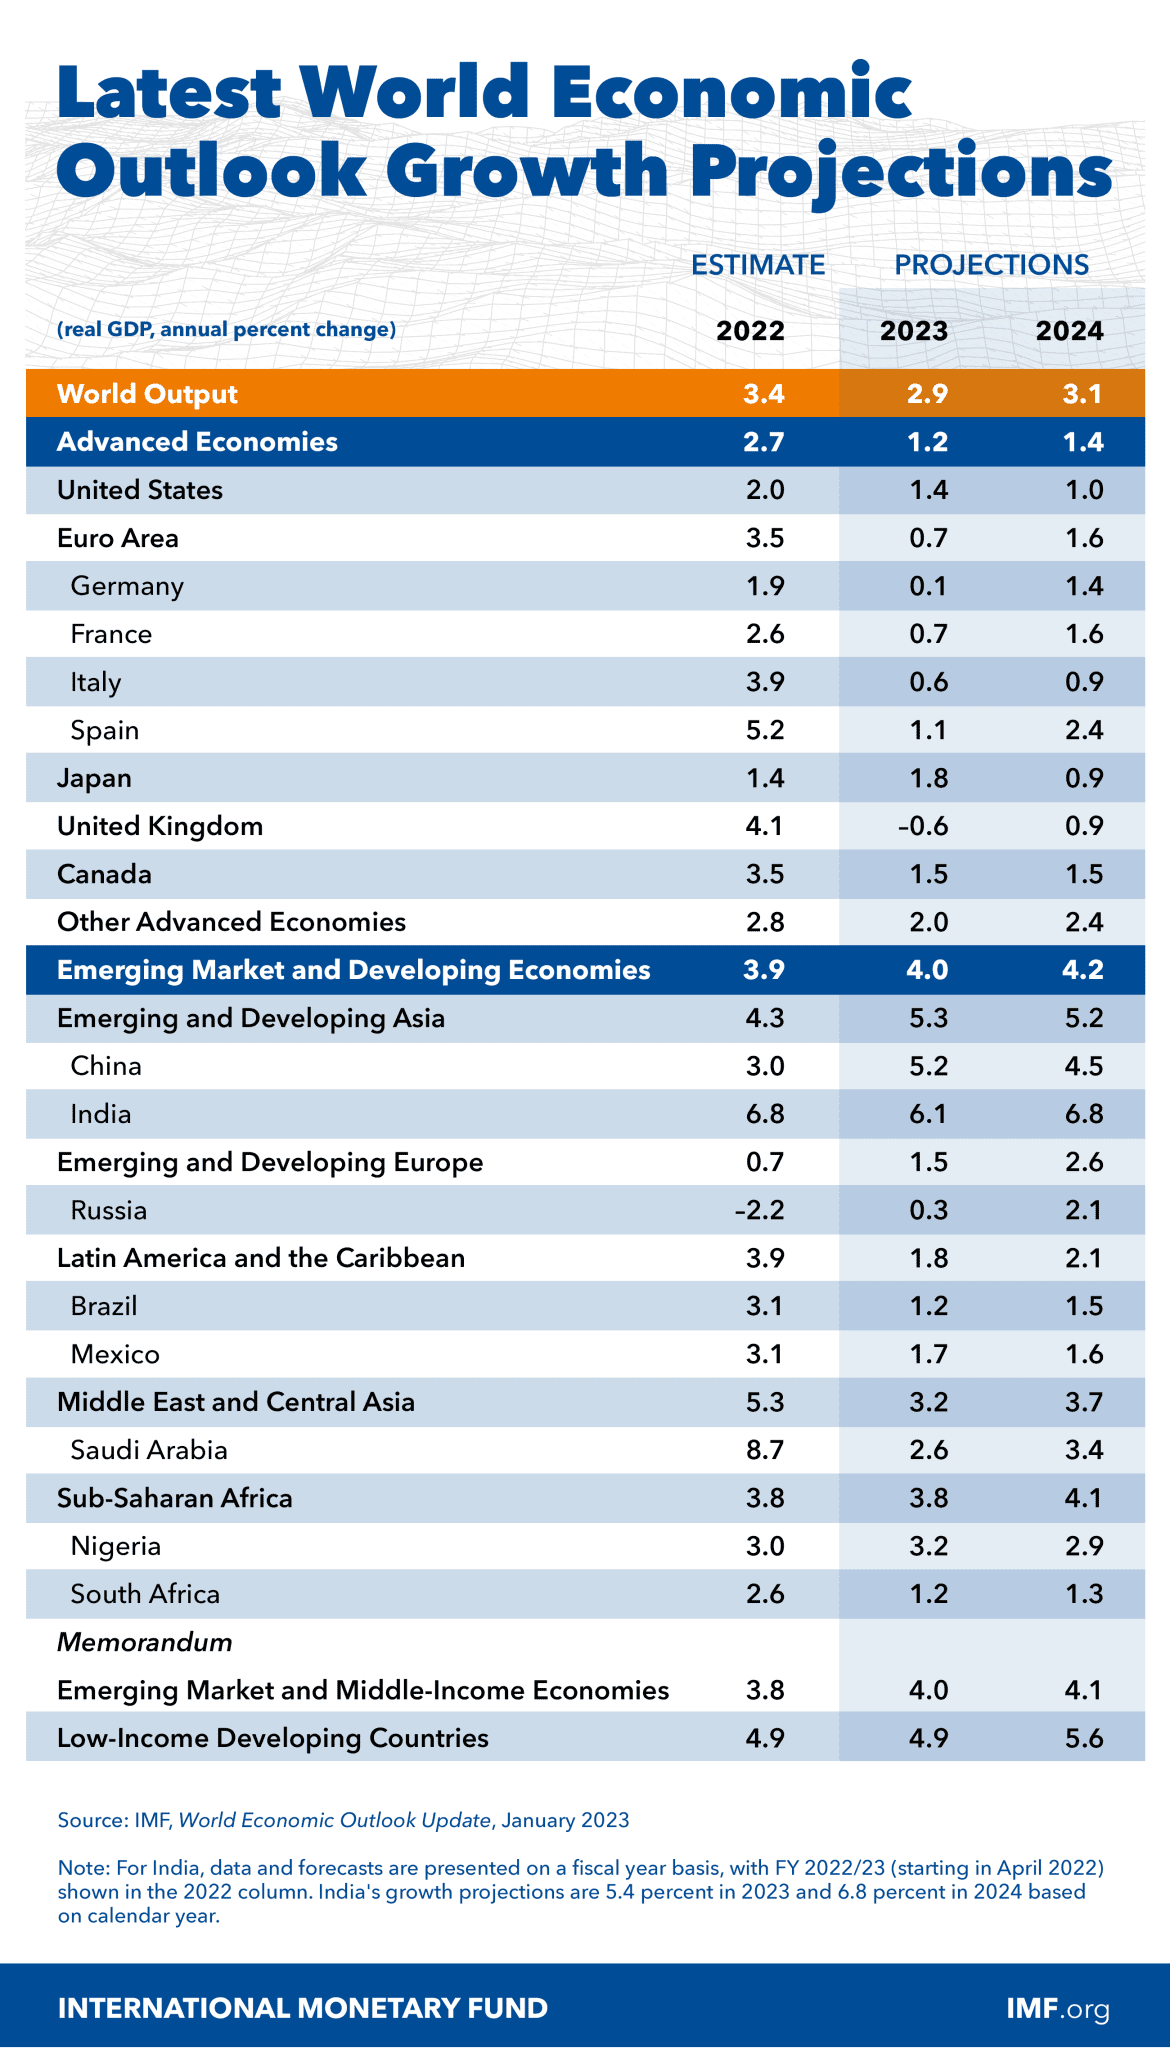
The International Monetary Fund (IMF) has released the World Economic Outlook 2023, providing key insights into global economy & forecast for 2023 & 2024. The global economy (GDP) is forecast to grow 2.9% in 2023 (2022: 3.4%) and 3.1% in 2024, with inflation at 6.6% in 2023 (2022: 8.8%) and 4.3% in 2024. The 2023 global economy key drivers and risks are – Inflation, China Recovery, Domestic Economic Strength, Supply Side, Russia War in Ukraine, Geo-Politics, COVID-19, Debt Distress, and Financial Market Repricing. Emerging & Developing Economies are forecast to grow 4% vs Advanced Economies of 1.2%. 2023 GDP forecast for Top 10 Economies: United States +1.4%, China +5.2%, Japan +1.8%, Germany +0.1%, India +6.1%, United Kingdom -0.6%, France +0.7%, Canada +1.5%, Russia +0.3%, Italy +0.6%. Top 10 GDP 2022: United States $25 trillion, China $18.3 trillion, Japan $4.3 trillion, Germany $4 trillion, India $3.4 trillion, United Kingdom $3.1 trillion, France $2.7 trillion, Canada $2.2 trillion, Russia $2.1 trillion, Italy $1.9 trillion. The top 10 economies in the world represents 66% of global GDP (2022: $101.5 trillion). Selected GDP forecast for Asia-Pacific (APAC) Economies – Japan +1.8%, China +5.2%, India +6.1%, South Korea +1.7%, Indonesia +4.8%, Thailand +3.7%, Malaysia +4.4%, Philippines +5%, Australia +1.6%. Selected GDP for APAC Economies – China $18.3 trillion, Japan $4.3 trillion, India $3.4 trillion, South Korea – $1.7 trillion, Indonesia – $1.2 trillion, Thailand $543 billion, Malaysia $434 billion, Philippines $401 billion, Australia $1.7 trillion. Financial Centres GDP: UAE $503 billion, Hong Kong $368 billion, Singapore $423 billion, Luxembourg $82 billion. (GDP ~ Gross Domestic Product) View key summary below | Full Report here
“ IMF World Economic Outlook 2023: GDP +2.9% in 2023 with Inflation at 6.6%, Key Drivers & Risks are Inflation, China Recovery, Domestic Economic Strength, Supply Side, Russia War in Ukraine, Geo-Politics, COVID-19, Debt Distress & Financial Market Repricing “
- Article continues below - Web links may be disabled on mobile for security. Please click on desktop. Quick Links, Ads & Announcements Caproasia Access | Events | Summits | Register Events | The Financial Centre The 2023 Investment Day | 2023 Family Office Summits | Family Office Circle New to Caproasia Learn More | Sign Up | Subscribe | Register Events The 2023 Investment Day | HK & SG Where do you invest $250k, $1 million, $10 million, $100 million or $1 billion? Can you generate IRR of 10% / 15% / 20% or more? Private Equity, Hedge Funds, Boutique Funds, Private Markets & more. Taking place on 28th March 2023 in Hong Kong, 4th April 2023 in Singapore, and Virtual Investment Day in April 2023. Visit | Register here


IMF World Economic Outlook 2023
 Shanghai, China
 The International Monetary Fund (IMF) has released the World Economic Outlook 2023, providing key insights into global economy & forecast for 2023 & 2024.
IMF World Economic Outlook 2023 Key Summary – Findings
1) GDP Forecasts
2023 Forecast
- GDP Forecast: +2.9% (2022: +3.4%)
- Inflation Forecast: +6.6% (2022: +8.8%)
- Advanced Economies: +1.2% (2022: +2.7%)
- Emerging & Developing Economies: +4% (2022: +3.9%)
2024 Forecast
- GDP Forecast: +3.1% (2000-2019 – Average +3.8%)
- Inflation Forecast: +4.3% (2017 – 2019: Average +3.5%)
- Advanced Economies: +1.4%
- Emerging & Developing Economies: +4.2%
Top 10 GDP 2022
In 2022, the global GDP is estimated at $101.5 trillion, with the top 10 economies representing 66% of global GDP. In Asia, China, Japan & India are the top 3 largest economies, 3 of the top 5 largest economies in the world, and represents 25% of global GDP.
Americas & Europe GDP Growth in 2023 (2024)
Americas & Europe GDP 2022
Asia-Pacific GDP Growth in 2023 (2024)
Asia-Pacific GDP 2022
Selected Countries GDP
- Taiwan – $828 billion
- Switzerland – $807 billion
- Norway – $504 billion
- Vietnam – $413 billion
- New Zealand – $242 billion
- Qatar – $221 billion
Financial Centres GDP
- United Arab Emirates – $503 billion
- Hong Kong – $368 billion
- Singapore – $423 billion
- Luxembourg – $82 billion
2) IMF 2022 / 2023 Global Outlook
Economy Upside Risks
Economy Downside Risks
IMF Policy Priorities
Urgent Actions to Strengthen Multilateral Cooperation Needed
Speeding the green transition
IMF World Economic Outlook 2023
 IMF World Economic Outlook 2023
About IMF
The IMF was established in 1944 in the aftermath of the Great Depression of the 1930s. 44 founding member countries sought to build a framework for international economic cooperation. Today, its membership embraces 190 countries, with staff drawn from 150 nations. The IMF is governed by and accountable to those 190 countries that make up its near-global membership.
Quick Links Caproasia Access | Events | Summits | Register Events | The Financial Centre The 2023 Investment Day | 2023 Family Office Summits | Family Office Circle 2021 Data Release 2020 List of Private Banks in Hong Kong2020 List of Private Banks in Singapore 2020 Top 10 Largest Family Office2020 Top 10 Largest Multi-Family Offices2020 Report: Hong Kong Private Banks & Asset Mgmt - $4.49 Trillion2020 Report: Singapore Asset Mgmt - $3.48 Trillion AUM For Investors | Professionals | Executives Latest data, reports, insights, news, events & programs Everyday at 2 pm Direct to your inbox Save 2 to 8 hours per week. Organised for success Register Below For CEOs, Heads, Senior Management, Market Heads, Desk Heads, Financial Professionals, Investment Managers, Asset Managers, Fund Managers, Hedge Funds, Boutique Funds, Analysts, Advisors, Wealth Managers, Private Bankers, Family Offices, Investment Bankers, Private Equity, Institutional Investors, Professional Investors Get Ahead in 60 Seconds. Join 10,000 + Save 2 to 8 hours weekly. Organised for Success. Sign Up / Register You are:
Professional InvestorInstitutional InvestorFamily OfficeAdvisorFinancial ProfessionalExecutiveOthers
Select:
Mailing ListFree TrialSubscription YearlySubscription MonthlyMembershipEvents
Interests / Events / Summits / Roundtables / Networking:
Professional InvestorPrivate WealthFamily OfficePrivate BankingWealth ManagementInvestmentsAlternativesPrivate MarketsCapital MarketsESG & SICEO & EntrepreneursTax, Legal & RisksHNW & UHNWs Insights
Your Name*
Company*
Job Title*
Email 1 (Work / Personal)*
Email 2 (Work / Personal)
Contact No.
Country
Your Message (leave blank if none)

 New to Caproasia Learn More | Sign Up | Subscribe | Register Events Caproasia Users
 - Manage $20 million to $3 billion of assets
- Invest $3 million to $300 million
- Advise institutions, billionaires, UHNWs & HNWs
- Caproasia.com
- Caproasia Access
- Caproasia Events
- The Financial Centre | Find Services
- Membership
- Family Office Circle
- Professional Investor Circle
- Investor Relations Network
- Professional Investor
- Family Office
- HNW Partnership
- Family Office Circle
- Family Office Networking
- Family Office Roundtable
- The Family Office Summit
- 28th March 2023 - Hong Kong
- 4th April 2023 - Singapore
- April 2023 - Virtual
- Sept 2023 - Hong Kong
- Oct 2023 - Singapore
- Oct 2023 - Hong Kong
- Visit: The Investment Day | Register: Click here
- The Investment Summit
- The Private Wealth Summit
- The Family Office Summit
- The CEO & Entrepreneur Summit
- The Capital Markets Summit
- The ESG / Sustainable Investment Summit
Owl Media Group takes pride in providing social-first platforms which equally benefit and facilitate engagement between businesses and consumers and creating much-needed balance to make conducting business, easier, safer, faster and better. The vision behind every platform in the Owl Media suite is to make lives better and foster a healthy environment in which parties can conduct business efficiently. Facilitating free and fair business relationships is crucial for any thriving economy and Owl Media bridges the gap and open doors for transparent and successful transacting. No advertising funds influence the functionality of our media platforms because we value authenticity and never compromise on quality no matter how lucrative the offers from advertisers may seem.